~technology-visual-c | Bookmarks (27)
-
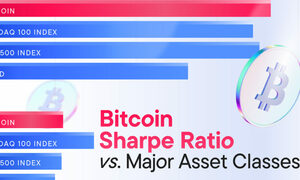
Ranked: Bitcoin Returns vs. Major Asset Classes
Visual Capitalist has partnered with Franklin Templeton in this graphic to explore how bitcoin returns compare...
-
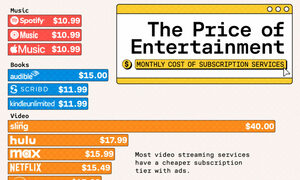
Chart: The Price of Entertainment Subscription Services
From Netflix to Google Play Pass, we compare the cost of subscription services across a range...
-
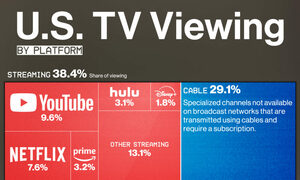
How Do Americans Watch TV in 2024?
While broadcast and cable remain the most popular form of watching TV, streaming services are at...
-
5 Ways Nuclear Can Power The Future
As global electricity demand rises, nuclear power stands out as a leading solution to help ensure...
-
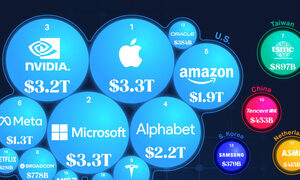
Ranked: The 20 Biggest Tech Companies by Market Cap
In total, the 20 biggest tech companies are worth over $20 trillion—nearly 18% of the stock...
-
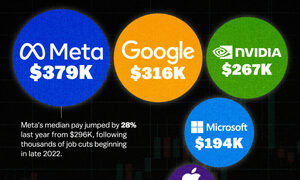
What is the Median Pay of Magnificent Seven Companies?
The Magnificent Seven companies are fueling stock market gains. In this graphic, we show the median...
-
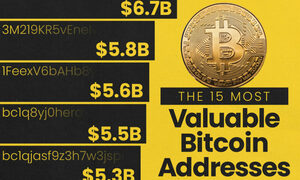
Visualizing the 15 Most Valuable Bitcoin Addresses
The most valuable Bitcoin address is worth $17.5B. The post Visualizing the 15 Most Valuable Bitcoin...
-
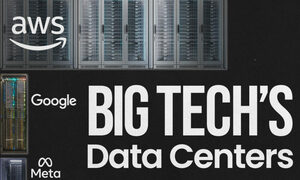
Charted: How Many Data Centers do Major Big Tech Companies Have?
Data centers are critical for modern business operations and digital services, including cloud computing, e-commerce, social...
-
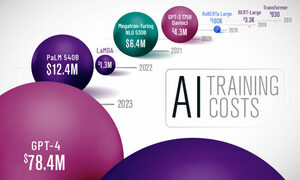
Visualizing the Training Costs of AI Models Over Time
In this graphic, we show how the cost of training AI models has skyrocketed given the...
-
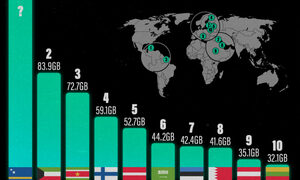
Visualizing the Top Countries, by Mobile Data Usage
Today, mobile data usage is rising rapidly around the world. Here are the top 10 countries...
-
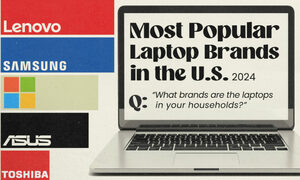
What Laptop Brands do Americans Use in 2024?
Statista surveyed nearly 7,000 American adults aged 18–64 asking them what laptop brands were in their...
-
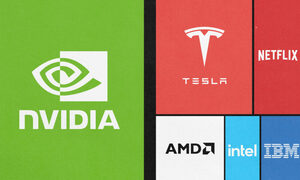
Nvidia is Worth More Than All of These Companies Combined
Gain a unique perspective on the market cap of Nvidia in this simple graphic. The post...
-
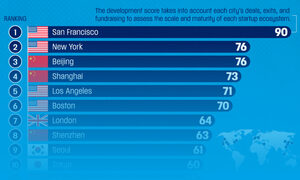
Ranked: The Top Startup Cities Around the World
Here are the global startup ecosystem rankings, highlighting the scale and maturity of major tech hubs...
-
Visualizing the 5 Most Common Cybersecurity Mistakes
Here are the top actions that pose cybersecurity risks, as the threat landscape evolves with greater...
-
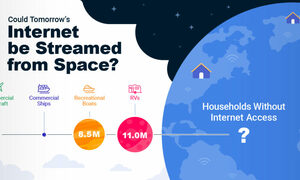
Charting the Next Generation of Internet
In this graphic, Visual Capitalist has partnered with MSCI to explore the potential of satellite internet...
-
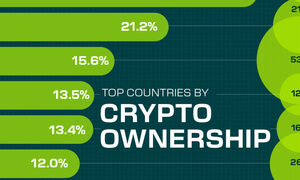
Countries With the Highest Rates of Crypto Ownership
While the U.S. is a major market for cryptocurrencies, two countries surpass it in terms of...
-
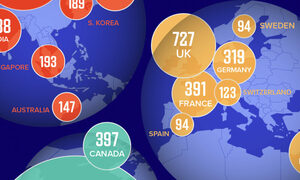
Mapped: The Number of AI Startups By Country
Over the past decade, thousands of AI startups have been funded worldwide. See which countries are...
-
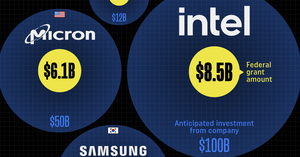
All of the Grants Given by the U.S. CHIPS Act
Intel, TSMC, and more have received billions in subsidies from the U.S. CHIPS Act in 2024....
-
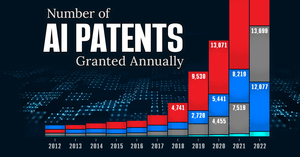
Visualizing AI Patents by Country
See which countries have been granted the most AI patents each year, from 2012 to 2022....
-
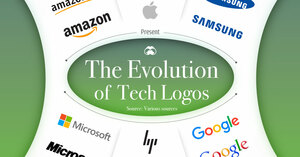
How Tech Logos Have Evolved Over Time
From complete overhauls to more subtle tweaks, these tech logos have had quite a journey. Featuring:...
-
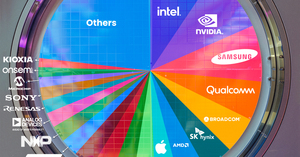
Ranked: Semiconductor Companies by Industry Revenue Share
Nvidia is coming for Intel’s crown. Samsung is losing ground. AI is transforming the space. We...
-
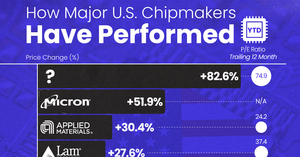
The Stock Performance of U.S. Chipmakers So Far in 2024
The Nvidia rocket ship is refusing to slow down, leading the pack of strong stock performance...
-
The Evolution of Intelligence
The expert consensus is that a human-like machine intelligence could emerge by 2059, but what if...
-
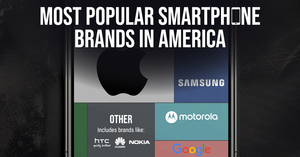
Ranked: The Most Popular Smartphone Brands in the U.S.
This graphic breaks down America's most preferred smartphone brands, according to a December 2023 consumer survey....