- Name: rpi_tempmon
- Title : Display the ARM CPU and GPU temperature of Raspberry Pi
- Description:
This python program will display the ARM CPU and
GPU temperature of a Raspberry Pi
features include command line display, GPIO (LED) output, logging, alarm limit,
graphing, desktop notification, stress tests and e-mailing options.
It is run in terminal and uses matplotlib
plots for graph modes.
- Author: Gavin Lyons
- URL: https://github.com/gavinlyonsrepo/raspeberrypi_tempmon
- Tested on Toolchains:
- RPI 3 model B. Raspbian 10 Buster, 32 bit. Python 3.7.3.
- RPI 3 model B. Raspbian 12 Bookworm, 64 bit. Python 3.11.2.
Latest version 2.4 (12-2023)
PyPi & pip , pipx
The program is present in python package index, Pypi. Install using pip or pipx to the location or environment of your choice. Package name = rpi-tempmon.py
Manually install from github
The package is also archived on github and can be manually download and installed via python and setup.py
curl -sL https://github.com/gavinlyonsrepo/raspberrypi_tempmon/archive/2.4.tar.gz | tar xz
cd raspberrypi_tempmon-2.4
python3 setup.py build
python3 setup.py install --userProgram is a python 3 package. Run in a terminal by typing rpi_tempmon.py or python3 rpi_tempmon.py:
rpi_tempmon.py -[options][arguments]
Options list (Note: Options are stand alone, not designed to be combined):
| Option | Description |
|---|---|
| -h | Print help information and exit |
| -v | Print version information and exit |
| -c | Enters continuous mode, optional number of seconds as a argument eg (-c 5) |
| -l | Creates and/or appends to log file at output folder |
| -L | Creates a sub-folder at output folder with date/time stamp and puts a log file in it |
| -m | Sends the log file to an email account |
| -g | graph mode, Generate a menu where 12 types of graphs can be selected |
| -a | parse log file and produces a data report in terminal |
| -n | send notifications to desktop, Number argument to define behaviour |
| -s | CSV mode , parses log.txt and converts it to log.csv, CSV file |
| -ST | Stress test CPU and measures temperature output to graph and csv file , optional number of test runs as a argument eg (-ST 5) |
rpi_tempmon files needed are listed below:
| File Path | Description |
|---|---|
| rpi_tempmon.py | The main python script |
| RpiTempmonWork.py | python module containing various utility functions used by main |
| RpiTempmonGraph.py | python module dealing with graph output by matplotlib |
| $HOME/.config/rpi_tempmon/rpi_tempmon.cfg | config file |
| README.md | help file |
Config file: The config file with dummy values is created if missing. A dummy config file is available in documentation folder at repository , used for -m mail option, GPIO/LED feature and the alarm function.
The setting "RPI_AuthUser" the is email address destination of data from -m option.
Mail_Alert(one: mail alert on with -l option, zero: off)
The other settings are ALARM_MODE which should be set to one or zero(one: alarm on, zero: off)
CPU_UPPERLIMIT is the temperature limit of CPU in Centigrade, should be a positive integer. If alarm mode is on when CPU temperature goes above this limit, the alarm function will activate.
LED_MODE which should be set to one or zero(one: LED mode on, zero: off) if on an GPIO pin will switch on during an alarm state in continuous and normal mode. The RPI GPIO pin as defined by GPIO_LED number. You can connect an LED or another electronic component to this pin.
Make sure to include the [MAIN] header and all settings just as below or copy from the example file.
Settings:
[MAIN]
RPI_AuthUser=examplemail@gmail.com
MAIL_ALERT = 1
ALARM_MODE = 1
CPU_UPPERLIMIT = 60
LED_MODE = 0
GPIO_LED = 26
Screenshots, example config/log files are also available in documentation.
The output folder for log files is currently fixed at:
$HOME/.cache/rpi_tempmon/- simple MSMTP - Version: 1.6.6-1- Program which delivers email from a computer to a mailhost. MSMTP help Optional, ONLY used by mail functions. light SMTP client with support for server profiles client that can be used to send mails . (SMTP server), needed only for -m mail option. Also needs to install another few small dependencies (mpack etc) in order to send attachment. See mail mode in features for setup.
$ sudo apt install msmtp msmtp-mta mailutils mpack
- sysbench - Version 0.4.12-1.1 - benchmarking tool. sysbench Optional, ONLY used by stress test option -ST.
$ sudo apt install sysbench.- libnotify-bin - Version 0.7.6-2 - sends desktop notifications to a notification daemon. libnotify Optional, This is ONLY needed if using the -n option which uses the notify-send command.
$ sudo apt install libnotify-bin-
matplotlib - Version: 2.2.2 - Python plotting package. matplotlib help The graph modules requires python module matplotlib to draw graphs, This is for -g and -ST options. Installed by rpi_tempmon setup.py during installation in theory.
-
psutil - Version (2.1.1) - Library for retrieving info on PC. psutil Used to retrieve some CPU and memory information. Installed by setup.py during installation.
-
RPi.GPIO - version0.6.4) - This package controls the GPIO on a Raspberry Pi. rpi.gpio Should be installed by default on most OS, like Raspibian.
For a raspberry pi the official operating temperature limit is 85°C, and as a result the Raspberry Pi should start to thermally throttle performance around 82°C. The GPU and CPU are closely correlated to within a degree usually.
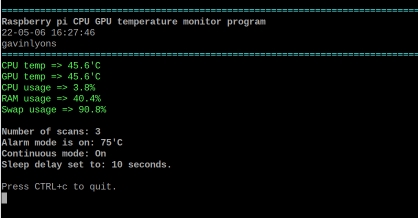
The program calculates the ARM CPU and GPU temperature of a Raspberry Pi and outputs them in Centigrade together with datetime stamp. Also shows CPU, RAM memory usage .
The program has ten features
- Normal mode - output to screen with optional GPIO output, prompt for update.
- Continuous mode - output to screen with optional GPIO output, updates based on timer.
- Logfile mode - output to single logfile(also mail mode if mail alert mode on and triggered).
- Logfolder mode - output to multiple logfile in separate folders.
- Mail mode - output to email.
- Graph mode - Displays a graph of logfile created in mode 3
- CSV mode - parses log.txt and converts it to log.csv for external use
- Data mode - parses log file and produces a small report.
- Notify mode - send notifications to desktop, Number argument to define behaviour
- Stress test mode - Stresses the CPU with math and records results in csv file and graph.
1. normal mode
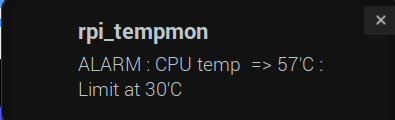
Normal mode is run by running program with no command line arguments. In normal mode output, Data is sent to the terminal with prompt to repeat or quit. The GPIO pin in config file will be turned on and Data in red is displayed in screen for an Alarm state, if setup in config file.
2. Continuous mode
Same as normal mode except in continuous mode. The program enters a delay between scan. This delay is set by positive integer argument placed after -c. For example "-c 30" will wait 30 seconds between scans. Data is sent to terminal screen. The GPIO pin in config file will be turned on and Data in red is displayed in screen for an Alarm state, if setup in config file.
3. & 4. Log modes
In logfile mode the data is appended into a file log.txt at output folder. With optional mail setup if alarm mode setup. For mode 3 an email is sent using mode 5 function, but with warning in title.
Sample output of logfile:
TS = 18-04-22 14:19:42
EP = 1524403183.0
GPU temperature = 48.3'C
CPU temperature = 48.3
Cpu usage = 40.4
RAM usage = 45.0
Swap usage = 98.6
Raspberry pi temperature monitor: raspberrypi
The log file is appended with "Warning:" text message if alarm state entered.
In logfolder mode in the output folder, a new sub-folder is created each time it is ran and a new log-file put in here. The sub-folder has following syntax 1250-02Jul17_RPIT HHMM-DDMMMYY_XXXX. This folder mode does not work with mail or graph mode at present.
Logging modes are designed to be used with UNIX automation like crontab. For example this crontab entry will run logfile mode once an hour, Note: The path to executable may differ on each users system.
0 * * * * /usr/local/bin/rpi_tempmon.py -l >/dev/null 2>&15. Mail mode
In mail mode an email is sent using msmtp. The mail contains the data from logfile mode only, it will NOT work with sub-folders from logfolder mode.
msmtp is used rather than than python inbuilt smtplib module as this program was originally a bash program and this a legacy of that, also allows access to msmtp config file for greater portability and security. The program originally used ssmtp but this is now obsolete in latest raspbian software.
In order to get mail mode working you must complete 3-4 steps.
- Set settings in rpi_tempmon config file, see Files and setup section. This file allows for user to set an email address without access to msmtp config file which should be set up just for root account.
- Install msmtp and dependencies as per installation section
- Configure msmtp configuration file MSMTP help A working example msmtprc config file for gmail is in documentation folder, "example_msmtprc".
- Optional, It is also possible you may need to configure your email account to accept msmtp mails this was the case for gmail and ssmtp. See here Login credentials not working with Gmail SMTP "Less secure app access" in google mail to On.
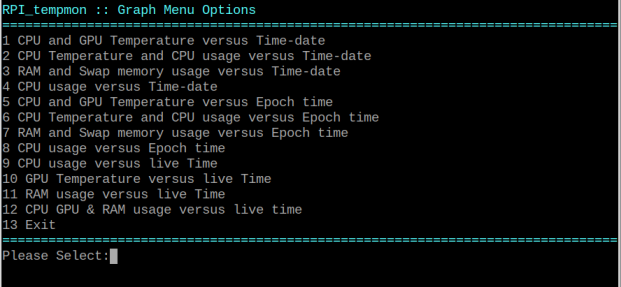
6. graph mode
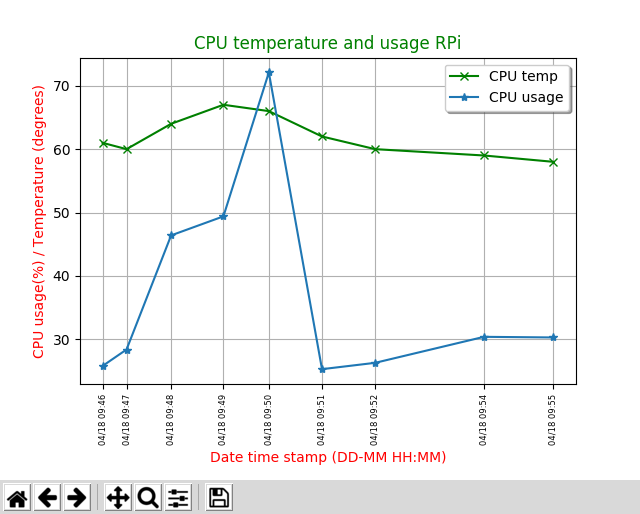
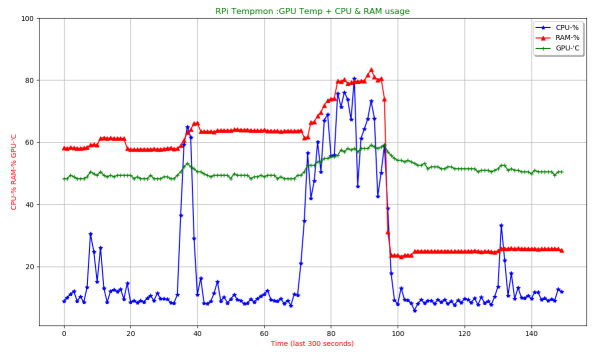
In graph mode, the program using matplotlib (plotting library) creates a plot of various data versus time. The logfile.txt created by logfile mode 3 is used for data for graph 1-8. graphs 1-4 use time-date stamp as yaxis value graphs 5-8 use Unix Epoch stamp as yaxis value, this is better for irregular data points across multiple dates. The graphs 9-12 are live plots sampled every two seconds for 150 points, so five minutes of live data.
Sample graph screenshot, screenshots of all others are in screenshot folder of repo.
7. CSV(comma-separated values) convert
New in Version 2.0. Run with -s on the CLI. Parses log.txt and creates log.csv. This csv file can be then used by user in another app. A comma-separated values (CSV) file is a delimited text file that uses a comma to separate values. This file can then be loaded into libreoffice calc. for further processing, for example.
sample output = time-data, CPU temp, GPU temp, CPU usage , RAM usage , swap usage
18-04-04 09:46:51,61.5,60.7,25.8,33.9,11.68. data mode
Parses log file created by logfile mode 3 and produces a data report on console.
9. notify mode
Send notifications to desktop, Numbered argument to define behaviour
After installing notify-send, Additional packages or steps
may be required to get notify-send working,
depending on system. for example
Jessie
- -n 2 = argument 2 = If run always display CPU temperature , no warning.
- -n 3 = argument 3 = If run only display if CPU temperature exceeds limit
10. Stress test mode
This mode uses the sysbench benchmarking tool. The test request consists in calculation of prime numbers up to a value of 20000. All calculations are performed using 64-bit integers. 4 worker threads are created. The number of test runs is passed on command line as integer max 50 min 2. CPU temperature and freq are recorded for each test run and are outputed to a csv file, called stresslog.csv . sample output = test run num, CPU temp, CPU usage.
1,56.9,27.1
2,61.3,99.7
At the end of test, there is an option to display results in a graph. Stress data carried out by rpi_tempmon for a RPi 3 can be found in repo here