


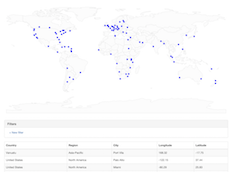
MapTable's primary function is to convert any dataset to a customizable set of components of Map, Filters and Table:
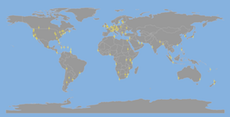
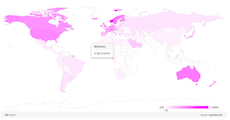
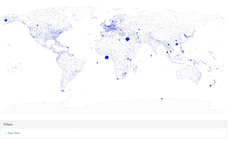
- Map - A fully customizable (zoom & pan) choropleth or heat map rendered using SVG. The map can be exported to a stand alone SVG for external consumption. The map can include markers based on lat/lon with tooltips. Markers and Map are dynamically update based on filters.
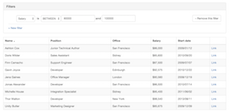
- Table - A tabular representation of your dataset which can be sorted by header rows. Primary sort is the first click and secondary sort is the second click when shift is held down. This also dynamically responds to filters.
- Filters - A programmatically generated list of drop downs and input fields to drill down into your dataset
This library was originally conceived to render the home page and next generation of IXP directory for Packet Clearing House (PCH).
You can also browse other code samples and examples
- D3.js
- TopoJSON*: homepage or download (cdnjs)
- FileSaver.js*: homepage or download (cdnjs) - only used if you want to do client side SVG export
* Only used if you need a map
Here is minimum amount of HTML to render a MapTable with Map, Filter and Table.
<div id='vizContainer'></div>

<script src="d3.min.js"></script> <!-- You can import it from cdnjs.com or bower-->
<script src="topojson.min.js"></script> <!-- You can remove this line if you're not using the map --> <!-- You can import it from cdnjs.com or bower -->
<script src="maptable.min.js"></script> <!-- You can import it from cdnjs.com or bower -->
<script>
  var viz = d3.maptable('#vizContainer')
              .csv('dataset.csv')
              .map({ path: 'world-110m.json' }) // You can remove this line if you want to disable the map
              .filters() // You can remove this line if you want to disable filters
              .table() // You can remove this line if you want to disable the table
              .render(); // This is important to render the visualization
</script>
MapTable is available on cdnjs.com. Remember though, cool kids concatenate their scripts to minimize http requests.
If you want to style the MapTable elements with some existing styles, you can prepend the above HTML with:
<link rel="stylesheet" href="https://maxcdn.bootstrapcdn.com/bootstrap/3.3.5/css/bootstrap.min.css">
<link rel="stylesheet" href="../maptable.css">To create a visualization (Map or/and Table or/and Filters) of your dataset, you need to provide first the container of your visualization
<div id='vizContainer'></div>The default order of the 3 components is Map, Filters and Table. If you want to place the components in a different order, you can put them on the main container:
<div id='vizContainer'>
  <div id='mt-map'></div>
  <div id='mt-filters' class='panel panel-default'></div>
  <div id='mt-table'></div>
</div>
You instantiate the MapTable library into the viz variable based on the #vizContainer ID you declared in the DOM:
<script>
  var viz = d3.maptable('#vizContainer'); // #vizContainer is the css selector that will contain your visualization
</script>
The MapTable viz declaration in the above example is a chain of functions. The possible functions that you can use are:
- viz.json(jsonPath[, preFilter]) with
jsonPathas string andpreFilteras function that filters the dataset upfront. - viz.jsonData(jsonData[, preFilter]) with
jsonDataas string andpreFilteras function that filters the dataset upfront. - viz.csv(csvPath[, preFilter]) with
csvPathas string andpreFilter. - viz.csvData(csvData[, preFilter]) with
csvDataas string andpreFilter. - viz.tsv(tsvPath[, preFilter]) with
tsvPathas string andpreFilter. - viz.tsvData(tsvData[, preFilter]) with
tsvDataas string andpreFilter. - viz.columns(columnDetails) with
columnDetailsas a JS dictionary. You can add/remove it of you want to customize your columns or create virtual columns based on the data. - viz.map(mapOptions) with
mapOptionsas a JS dictionary. You can add/remove it of you want a map on your visualization. - viz.filters(filtersOptions) with
filtersOptionsas a JS dictionary. You can add/remove it of you want filters on your visualization. - viz.table(tableOptions) with
tableOptionsas a JS dictionary. You can add/remove it of you want a table on your visualization. - viz.render([onComplete]) that closes the chain and renders the visualization. Don't forget this! It can take an optional callback function onComplete, that's executed when MapTable finishes rendering its components. For example if you have
function alertTest(){ alert('test!'); }you would call it withviz.render(alertTest).
Example with preFilter
var viz = d3.maptable('#vizContainer')
        .json('dir_data.json', (d) => parseInt(d.traffic) > 0)
        .map({ path: 'countries.json' })
.render();Datasets can be defined by using one of the these three sources:
# viz.json(url)
Import JSON file at the specified url with the mime type "application/json".
# viz.csv(url)
Import CSV file at the specified url with the mime type "text/csv".
# viz.tsv(url)
Import TSV file at the specified url with the mime type "text/tab-separated-values".
To plot lands and countries on the map, we're using TopoJSON library. The map can be generated through this tool: topojson-map-generator.
In order to plot your dataset on a map, there are minimum set of columns needed.
If you're planning to add markers on your map, you would need to provide latitude, longitude of your markers. You can also edit these keys name using the map options longitudeKey, latitudeKey.
[
    {"longitude": "13.23000", "latitude": "-8.85000"},
    {"longitude": "168.32000", "latitude": "-17.75000"},
]
If you're planing to add country related information, you should provide consistent country information on your dataset from the TopJSON file. You should provide at least one of these types on your mapOptions:
countryIdentifierKey:(string, default: 'country_code') Column name of country identifier (from the dataset). It goes as pair with the optioncountryIdentifierType.countryIdentifierType:(string, default: 'iso_a2') Country identifier type that we're using to attach data to countries on the map. The available types are:iso_a2(default): ISO_3166-1_alpha-2 country code formatiso_a3: ISO_3166-1_alpha-3 country code formatname: Country name that came from the GeoJSON map file.continent: Continent name that came from the GeoJSON map file.
For example for this dataset:
[
  {"country_code": "MAR", "Country Name": "Morocco", "bar": "foo"},
  {"country_code": "FRA", "Country Name": "France", "bar": "foo"},
]
You would use these options:
{
  countryIdentifierKey: 'country_code',
  countryIdentifierType: 'iso_a3'
}
or
{
  countryIdentifierKey: 'Country Name',
  countryIdentifierType: 'name'
}By default, MapTable imports all the columns and detects their format automatically. As well, you can customize behaviors of specific columns and create virtual columns.
# viz.columns(columnDetails) with columnDetails as a JS dictionary. You can add/remove it of you want to customize your columns or create virtual columns based on the data.
<PUT_YOUR_COLUMN_KEY>:(Object) Provide the columns key here to apply the options below to it. If this key is not defined in yoru dataset, then it will be dynamically added as virtual column:nowrap:(bool, default: false) When present, it specifies that the content inside a that column should not wrap.title:(string, default: columnKey) What we show as column name in filters and table.filterMethod:(string, default: 'field') Column format type, used for filtering. Available options:field: filter by keyworddropdown: exact match using a dropdowncompare: filter using comparison (≥, ≤, between ....)
virtual: (function(d), default: null) To create a new column that doesn't exists in the dataset, and we'd like to show it on the table or filters. You can also use it if you want to transform an existing column.cellContent: (function(d), default: null) Function that transforms an existing content using other rows. (for example to change the color depending on the data).dataParse:(function(d), default: null) Function that return the formatted data used to sort and compare cells.filterInputType:(string, default: 'text') HTML input type that we're using for the filters for that specific column (e.g. date, number, tel ...)
Example (adding nowrap and type to the region column key):
.columns({
  region: {
    nowrap: true,
    filterMethod: 'dropdown'
  }
})For the below examples, we define viz as the variable that loads MapTable.
Functions that have d as parameter, means that d is a JS dictionary that contains data for one row.
Functions that have groupedData as parameter, means that groupedData is a JS dictionary { key: 'groupedByKey', values: [ {d}, ... ] } that contains the key that have been used to group the data, and the matching values related to that grouping.
#viz.map(mapOptions) with mapOptions as a JS dictionary. You can add/remove it of you want a map on your visualization.
-
path:(string, required if pathData not set) URL of the TOPOJSON map, you can get them from Mike Bostock's repo: world atlas and us atlas. Or use this tool to generate these files as we did on the examples. -
pathData:(string, required if path not set) string containing the TOPOJSON map -
onComplete:(function, default: null) Callback function when the map first loaded. -
onRender:(function, default: null) Callback function when the map finished rendering. -
width:(integer, default:'window.innerWidth') Map Width. -
height:(integer, default:'window.innerHeight') Map Height. -
saveState:(bool, default: true) Save zoom state into the URL -
zoom:(bool, default: true) Enable zoom on the map (when scrolling up/down on the map). -
filterCountries:(function(country)) Filter countries follow a specific condition. Example:```js filterCountries: (country) => country.id !== 'AQ', // to remove Antarctica from the map ``` -
title:(object, default: see below) Add a title within the map.-
title.bgColor:(string, default: '#000000') Title font size. -
title.fontSize:(integer, default: 12) Title font size. -
title.fontFamily:(string, default: 'Helevetica, Arial, Sans-Serif') Title font family. -
title.content:(function(countShown, countTotal, filtersDescription) Function to define how the title is rendered -
title.source:(function())_ Function to define how the HTML in the title. Example:```js title: { bgColor: "#F5F5F5", fontSize: "11", content: function(countShown, countTotal, filtersDescription) { if (countShown === 0 || countTotal === 0) out = "No data shown"; else if (countShown < countTotal) out = 'Showing <tspan font-weight="bold">' + countShown + '</tspan> from <tspan font-weight="bold">' + countTotal + "</tspan>"; else out = '<tspan font-weight="bold">' + countTotal + "</tspan> shown"; if (filtersDescription !== '') out += " — " + filtersDescription; return out; }, source: function() { return 'Source: <a xlink:href="http://www.example.com" target="_blank"><tspan font-weight="bold">example.com</tspan></a>'; } }, ```
-
-
scaleZoom:([integer, integer], default: [1, 10]) The map zoom scale. -
scaleHeight:(float, default: 1.0) Ratio to scale the map height. -
autoFitContent:(bool, default: true) Enable auto zoom to focus on the active markers. -
fitContentMargin:(integer, default: 10) Padding in pixels to leave when we filter on a specific area. -
ratioFromWidth:(float, default: 0.5) Ratio between the height and the width: height/width, used to deduce the height from the the width. -
countryIdentifierKey:(string, default: 'country_code') Column name of country identifier (from the dataset). It goes as pair with the optioncountryIdentifierType. -
countryIdentifierType:(string, default: 'iso_a2') Country identifier type that we're using to attach data to countries on the map. The available types are:iso_a2(default): ISO_3166-1_alpha-2 country code formatiso_a3: ISO_3166-1_alpha-3 country code formatname: Country name that came from the GeoJSON map file.continent: Continent name that came from the GeoJSON map file.
-
longitudeKey:(string, default: 'longitude') Column name of the longitude (from the dataset). -
latitudeKey:(string, default: 'latitude') Column name of the latitude (from the dataset). -
exportSvg:(string, default: null) URL endpoint to download the current visualization as SVG. Read more on the section export SVG. (more details on a the section "Export as SVG") -
exportSvgClient:(bool, default: false) Show button to download the current visualization as SVG using only the client browser instead of querying the backend (in the opposite ofexportSvg). You'll need to download FileSaver.js and add a<script src="filesaver.min.js">to make it work. You may also use the CDN version in your<script>source. -
watermark:(object, default: null) Add a watermark within the map.-
watermark.src:(string) URL of the image (svg, png, jpg). -
watermark.width:(integer) Image width. -
watermark.height:(integer) Image height. -
watermark.position:(string) Watermark position (top|middle|bottom) (left|middle|right). e.g.bottom left. -
watermark.style:(string) Additional css style for the watermark.Example:
watermark: {
  src: 'https://example.com/image.svg',
  width: 130,
  height: 60,
  position: "bottom left",
  style: "opacity:0.1"
},
-
-
markers:(object, enabled by default) Add markers on the map. Set it tofalseto disable it.markers.customTag:(function(markerObject)), default: null) This is more advanced feature. If you'd like to override the default market tag (svg:circle) to something different (like an image), you can use this callback function to append to the markerObject your custom implementation (see below example). x and y are coordinates in pixels of the marker.markers.attrX:(string, default: 'cx') Attribute to position the marker on the X-Axismarkers.attrY:(string, default: 'cy') Attribute to position the marker on the Y-Axismarkers.attrXDelta:(integer, default: 0) Left relative margin of the markermarkers.attrYDelta:(integer, default: 0) Top relative margin of the markermarkers.groupBy:(function(groupedData)) Given groupedData (the current row), function that returns a value that we group markers by. See this example for an implementation example.markers.tooltipClassName:(string, default: 'mt-map-tooltip popover bottom') Class name of the tooltip used for markers (we're using bootstrap).markers.tooltip:(function(groupedData)) Function that returns html that we would use as content for the tooltip. We recommend you to use the bootstrap popover..markers.attr:(object) The markers are by default SVG circle, you can custumize the radius, color or stoke of these markers here. You can use the attributerto set the radius orfillfor the color. More details on possible attributes here. We'll useras example in the following documentation.-
markers.attr.r:_(string or integer)_To set a static value -
markers.attr.r:(function) To represent the radius value based on the dataset, see this example on how we set the marker colorfillbased on the dataset. -
markers.attr.r:(object) Use an object with the following keys to correlate the value of the radius with the datasetmarkers.attr.r.aggregate:(object) Information on how we aggregate data. See this example to understand how we adjusted the radius of the markers based on the dataset.markers.attr.r.aggregate.key:(string) Which column we'll use to aggregate the value (it need to be a number)markers.attr.r.aggregate.mode:(enum('sum', 'count', 'avg', 'min', 'max', '50percentile', '95percentile'), default to 'count') what aggreation function we'll use.markers.attr.r.aggregate.scale:(enum('linear', 'rank', 'sqrt', 'pow2', 'pow3', 'log'), default: 'linear') what scale we'll aggregate the data.markers.attr.r.min:(string or integer) Attribute value for the minimum value on the scalemarkers.attr.r.max:(string or integer) Attribute value for the maximum value on the scalemarkers.attr.r.empty(string or integer) Attribute value if no data is linked to that countrymarkers.attr.r.rollup:DEPRECATED (use aggregate instead) (function(groupedData), default: groupedData => groupedData.length) Function for the values we're attaching to the country and attribute. return value needs to be an array that contains rows that match that country or marker. Defaults tovalues.length, the count of matching markersmarkers.attr.r.transform:(function(value, allRows), default: value) Function for changing the value for the current country. Can only accept valuetransform(value)to do a simpleMath.log(value)call or be defined to use more advanced logic withtransform(value, allRows)and then iterate overallRows(all rows from your csv/tsv/json) to calculate relative values like percentile. (It's recommended to useaggreggateif you want to have a different scale).
Example (grouping by value):
 markers: {
   tooltip: function(a) {
     out = '<div class="arrow"></div>';
     out += '<span class="badge pull-right"> ' + a.values.length + '</span><h3 class="popover-title"> ' + a.key + '</h3>';
     out += '<div class="popover-content">';
     for (i = 0; i < a.values.length; i++) out += " • " + a.values[i].long_name + "<br>";
     out += "</div>";
     return out;
   },
   attr: {
     r: { /* r is the circle attribute for radius */
       min: 1,
       max: 10,
       aggregate: {
         mode: "avg",
         key: "traffic",
         scale: "log10",
     }
   },
   fill: function(groupedData) {
     var totalTraffic = 0;
     groupedData.values.forEach(function(d) {
       totalTraffic += Number(d.traf);
     });
     if (totalTraffic && totalTraffic > 50000000) return 'green';
     return 'red';
   },
   stroke: "#d9d9d9",
   "stroke-width": 0.5
  }
},
Example (with custom tag - Advanced feature):
 markers: {
   className: 'starsMarker',
   customTag: function(markerObject){
     return markerObject.append("svg:image")
       .attr("xlink:href", "https://www.example.com/star.svg")
       .attr("width", "13")
       .attr("height", "27");
   },
   attrX: 'x',
   attrY: 'y',
   attrXDelta: -6,
   attrYDelta: -13
 },
-
-
countries:(object, enabled by default) Add countries on the map. You can not use this withmap.heatmap. Set it tofalseto disable it.countries.tooltip:(function(groupedData)) Function that returns html that we would use as content for the tooltip. We recommend you to use the bootstrap popover. The parameter isgroupedData(check above on the naming conventions for more details).countries.attr:(object) The countries are by default SVG path, you can custumize the color or stoke here. You can use the attributefillto set the color. More details on possible attributes here. We'll usefillas example in the following documentation.-
countries.attr.fill:(string or integer) To set a static value -
countries.attr.fill:(function) To represent the color value based on the dataset. -
countries.attr.fill:(object) Use an object with the following keys to correlate the value of the radius with the datasetcountries.attr.fill.aggregate:(object) Information on how we aggregate data. See this example to understand how the countries colors change based on the number of markers per country (choropleth).countries.attr.fill.aggregate.key:(string) Which column we'll use to aggregate the value (it need to be a number)countries.attr.fill.aggregate.mode:(enum('sum', 'count', 'avg', 'min', 'max', '50percentile', '95percentile'), default to 'count') what aggreation function we'll use.countries.attr.fill.aggregate.scale:(enum('linear', 'rank', 'sqrt', 'pow2', 'pow3', 'log10'), default: 'linear') what scale we'll aggregate the data.countries.attr.fill.min:(string or integer) Attribute value for the minimum value on the scalecountries.attr.fill.max:(string or integer) Attribute value for the maximum value on the scalecountries.attr.fill.minNegative:(string or integer, optional) Attribute value for the minimum (closest to 0) negative value. Use this andmaxNegativeif you want to show different colors on the map for negative values. It is optional. see this example for an implementation example.countries.attr.fill.maxNegative:(string or integer, optional) Attribute value for the maximum (farthest from 0) negative.countries.attr.fill.empty(string or integer) Attribute value if no data is linked to that countrycountries.attr.fill.legend:(bool, default: false) show or hide the legendcountries.attr.fill.rollup:(function(groupedData), default: groupedData => groupedData.length) DEPRECATED (use aggregate instead) Function for the values we're attaching to the country and attribute. return value needs to be an array that contains rows that match that country or marker. Defaults tovalues.length, the count of matching countriescountries.attr.fill.transform:(function(value, allRows), default: value) Function for changing the value for the current country. Can only accept valuetransform(value)to do a simpleMath.log(value)call or be defined to use more advanced logic withtransform(value, allRows)and then iterate overallRows(all rows from your csv/tsv/json) to calculate relative values like percentile. (It's recommended to useaggreggateif you want to have a different scale).
Example
countries: {
  tooltip: function(a) {
    out = '<div class="arrow"></div>';
    if (a.values.length === 0) {
      out += '<h3 class="popover-title"> ' + a.key + '</h3>';
      out += '<div class="popover-content">N/A</div>';
    } else {
      out += '<h3 class="popover-title"> ' + a.values[0]['country_name'] + '</h3>';
      out += '<div class="popover-content">' + a.values.length + '</div>';
    }
    return out;
  },
  attr: {
     fill: {
       min: "#a9b6c2",
       max: "#6c89a3",
       empty: "#f9f9f9",
       aggregate: {
         mode: "sum",
         key: "traffic",
         scale: "sqrt"
       }
    },
    stroke: "#d9d9d9",
    "stroke-width": 0.5
  },
},
-
-
night:(object, default: null) Add the night layer to the map-
night.date:(Date, default: new Date()) Which datetime do we want to display the night layer -
night.disableSun:(boolean, default: false) if you want to disable the sun layer -
night.sunRadius:(number, default: 10) radius of the sunExample
 night: {
   date: new Date(Date.parse('2023-01-01T00:00:00Z')),
},
-
-
timezones:(object, default: null) Add the timezones layer to the maptimezones.path:(string, required if pathData not provided) remote url of the topojson layers of the timezonestimezones.pathData:(string, required if path not provided) inline data of the topojson layers of the timezones
-
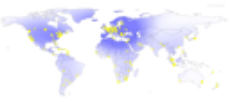
heatmap:(object, default: null) Add a heatmap on the map - we use concentrated circles on every location in the dataset. You can not use this withmap.countries.. See this example for an implementation example.-
heatmap.weightByAttribute:(function(d), default: null) Which attribute we would weight the gradient. it takes a anonymous function that exposesdas one row, and expect a float as returned value. -
heatmap.colorStrength:(float, default: 1) Adjusts heatmap color strength, (0 make things transparent, 1 normal behavior, > 1 to make the color darker) -
heatmap.weightByAttributeScale:('log' or 'linear', default: 'linear') Which scale we would use for the weight (only ifweightByAttributeis set). -
heatmap.mask:(bool, default: true) Mask the heatmap with countries so heatmap doesn't go over oceans -
heatmap.circles:(object) Properties of the circles that makes the heatmap gradient -
heatmap.circles.color:(string, default: "#FF0000") The color in HEX of the heatmap circles. -
heatmap.circles.blur:(float, default: 4.0) Blur radius that we apply on the heatmap. -
heatmap.borders:(object) Enable country borders. Set tofalseto disable it. -
heatmap.borders.stroke:(integer, default: 1) Country border stroke width. -
heatmap.borders.opacity:(integer, default: 0.1) Country border stroke opacity. -
heatmap.borders.color:(string, default: "#000") Country border stroke color.Example
heatmap: {
  weightByAttribute: function(d) {
    return parseInt(d.traf, 10);
  },
  weightByAttributeScale: 'log',
  circles: {
    color: '#0000FF',
    blur: 6.0,
  },
  borders: {
    opacity: 0.2,
  },
},
-
# viz.filters(options) with filtersOptions as a JS dictionary. You can add/remove it of you want filters on your visualization.
show:([string, ...], default: null) Set the order and the columns that we want to see in the filters.saveState:(bool, default: true) Save filters state into the URL
If you want to add a table on your visualization:
# viz.table(tableOptions) with tableOptions as a JS dictionary. You can add/remove it of you want a table on your visualization.
show:([string, ...], default: null) Set the order and the columns that we want to see in the table.onComplete:(function, default: null) Callback function when the table first loaded.onRender:(function, default: null) Callback function when the table finished rendering.className:(string, default: 'table table-striped table-bordered') Table class namerowClassName:(function(d), default: null) Function that returns the row class name depending on its content. Useful to highlight rows.defaultSorting:(object or table or object, default: see below) How we sort things on the table. You can specify a an array of two objects for secondary sorting.defaultSorting.key:(string, default: ) default sorting on which column.defaultSorting.mode:(string, default: 'asc') sorting mode:ascfor ascending,descfor descending.
collapseRowsBy:([string, ...], default: null) Array of columns that we want to be collapsed.
You can enable this feature via exportSvg and set it to a URL. This will allow users download the map on their computer as an SVG. However, you would need to set up a server endpoint that is going to allow users download the SVG file.
The sample code for a PHP server is located in /server/exportSvg.php. Contributions are welcomed for implementations of in other languages.
In the version 1.4.0 exportSvgClient was added to use only the browser to export the SVG.
- Simo Elalj @melalj - Original Author & Lead Architect
- Ashley Jones @Ths2-9Y-LqJt6 - Feature Requester & Deliverer, QA, Love, Release Engineer
You are welcomed to fork the project and make pull requests.
Install any items with "sudo":
- NVM, to support any nodejs version
Run these commands as your unprivileged user you're doing your development as:
- Run
nvm install 16to install node 16 - Run
nvm use 16to use node 16 - Run
npm config set python $(which python)to use set the python path - Run
npm installto install dependencies - Run
npm run devto start the local dev environment on http://localhost:5000 - Edit files in
./devand they will be automatically compiled to./src - To have production ready files, run:
gulp dist. All built files are located in the folder./dist - Enjoy 🍻
- Version 2.2.2 April 22 2023
- timezones: Removed text for UTC+14
- Version 2.2.1 April 22 2023
- night: Croping the night layer to remove Antartica
- timezones: Time values are now inside the timezone stripes
- timezones: set default sans serif font for the times
- Version 2.2.0 April 10 2023
- Added
map.timezonesto display the timezone stripes
- Added
- Version 2.1.0 April 10 2023
- Added
map.nightto display the night layer and the sun
- Added
- Version 2.0.0 April 10 2023
- Added
csvData,jsonData,tsvData, andmap.pathData - Fixed case sentivity for table sorting
- Tested build with Node 16 (using nvm)
- Added
- Version 1.7.3 November 26 2018
- Changed the rank worked so that value of
0is included in ranks.
- Changed the rank worked so that value of
- Version 1.7.2 November 15 2018
- Version 1.7.1 November 14 2018
- Fix Excessive updates to window history - Issue #93
- Version 1.7.0 November 14 2018 (Also includes items in unreleased 1.6.1)
- Allow map to be re-rendered with a column sort - Issue #88
- Fix cellContent: function(d) is called twice for every cell - Issue #87
- Fix Examples JS errors, padding - Issue #86
- Support secondary sorting in defaultSorting - Issue #78
- Provide dataset to map.title.content function to have better customizations - Issue #77
- Be able to set a property (like attr.fill) of an attribute based on the data - Issue #76
- Version 1.6.0 July 16 2018
- Add ability to support secondary sorting in defaultSorting - Issue #78
- Add ability to provide dataset to map.title.content function to have better customizations - Issue #77
- Add ability to set a property (like attr.fill) of an attribute (eg marker) based on the data - Issue #76
- Fix first column as defaultSorting - Issue #71
- Fix sorting, virtual columns demo - Issue #70
- Version 1.5.3 June 19 2018
- More better fix for permalink - Issue #74
- Version 1.5.2 June 18 2018
- Version 1.5.1 May 22 2017
- Fix default sort bug - Issue #66
- Version 1.5.0 May 22 2017
- Improve heatmap falloff - Issue #58
- Improve heatmap colors - Issue #56
- Improve heatmap marker handling - Issue #54
- Fix heatmap filter but - Issue #53
- Fix color bug on filters - Issue #43
- Fix marker bug on filters - Issue #41
- Add stateful URLs for filters, zoom and Lat/Long - Issue #38
- Add secondary sort on columns - Issue #37
- Version 1.4.0 December 20 2016
- Version 1.3 September 26 2016
- Allow fancier math on country values in
map.countries.attr.fill.transform()in GeoMap.js - Issue #32
- Allow fancier math on country values in
- Version 1.2.1 September 21 2016
- Fix bad use of
attrValuein GeoMap.js - Issue #30
- Fix bad use of
- Version 1.2 September 20 2016
- Version 1.1.1 July 14 2016
- Version 1.1 June 22 2016
- Version 1.0.2 May 16 2016
- Version 1.0.1 March 25 2016
- First Full featured release
- Version 1.0.0 December 9 2014
- Initial commit